EHS-Dashboard™ for Transforming Audits into Insights
Introduction
Audits are essential for verifying compliance and identifying improvement areas, but many organizations struggle to convert audit data into actionable insights. Modern EHS software, like the EHS-Dashboard, is changing this model: by leveraging advanced analytics, real-time monitoring, and automated reporting, facility managers can quickly pinpoint inefficiencies and implement corrective actions. The challenge is moving beyond static reports to dynamic dashboards that drive decisions.

The Challenge: From Static Reports to Actionable Intelligence
Traditional audit systems generate thick reports long after inspections occur. By the time teams review them, issues have either been resolved or forgotten. Without real-time dashboards, it’s difficult to track the status of corrective actions, spot patterns across sites or prioritize resources. The result is a reactive approach — fixing problems after they’ve already cost time and money. Organizations need a system that captures audit findings, assigns actions and visualizes data across multiple dimensions (site, regulation, severity) in real time.
Project Implementation Steps: Building an Analytics-Driven Audit Program
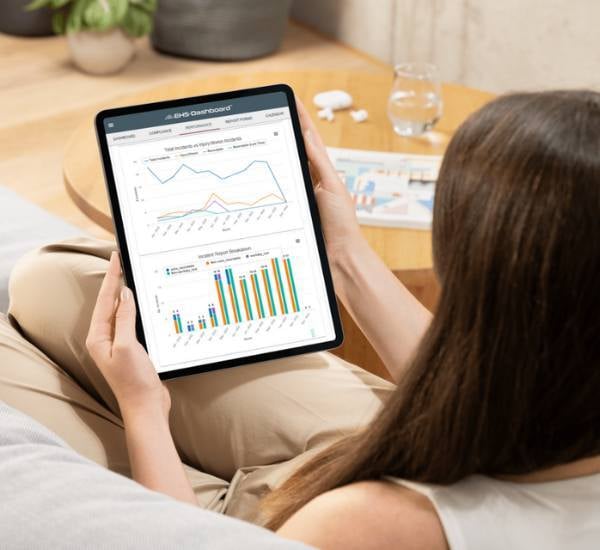
Implementing the EHS-Dashboard™ for analytics begins with digitalizing audit forms. Inspectors use tablets to conduct audits, capturing responses, photos and notes. The data is entered directly to the EHS-Dashboard™, where customizable charts display pass/fail rates by site, category or timeframe in real time. The system flags non-conformances and can assign corrective actions with due dates. Managers can filter dashboards to focus on high-risk areas or recurring issues. Regular meetings use the EHS-Dashboard™ as a focal point to review status and allocate resources.
Discovering the Solution: Implementing EHS-Dashboard™
A regional biotech company used to compile audit results in spreadsheets. When the company adopted the EHS-Dashboard, it configured dashboards to display compliance scores, overdue actions and trends by department. Real-time notifications alerted supervisors when corrective actions were overdue. Instead of waiting for end-of-month reports, leadership could intervene early.
Realizing the Results: Unlocking Dashboard Dividends
Analytics and real-time dashboards helped managers prioritize high-risk issues and allocate resources efficiently. The system’s charts were shared with executives to demonstrate continuous improvement and justify investments. Employees responded positively to transparency; seeing data on their area’s performance increased accountability. Overall, audits transformed from a compliance burden into a driver of operational excellence.
Continual Improvement: Driving Audit Success with Real-Time Data
Data analytics and reporting allow organizations to monitor key performance indicators (KPIs) such as incident rates, training completion and compliance scores. By analyzing trends over time, facility managers can identify root causes of non-conformance—like insufficient training or equipment failures—and implement targeted interventions. Regular reviews ensure that corrective actions address underlying issues rather than symptoms. The EHS-Dashboard™’s customizable visualizations empower teams to iterate and improve their programs continuously.
Conclusion: Turning Insights into Impact with EHS-Dashboard™
Audits shouldn’t end with a report filed away. By digitizing audit data and applying real-time analytics, organizations can move from reactive compliance to proactive excellence. The EHS-Dashboard™ transforms audit results into actionable insights, enabling faster decisions, better resource allocation and a culture of continuous improvement.
.jpg)